How to Measure the Difference Between National and Local Chains
The recent question on the table has been about how to quantify the regionality of different store chains. One possible way to do this, and probably the most simple, is the chi square test. There are certain drawbacks to the simplicity of the method, but it should work for general purposes.
The chi square test involves comparing what we would expect to observe against what we actually observe. In looking at the distribution of a given store chain, a perfectly national store chain would match the population distribution. A simple approximation of the population distribution would be the 210,000 discover ATM locations. If we divide the country into its 206 Designated Market Areas (DMAs), we can calculate the proportions per DMA. Then we see how each list compares to those proportions, and we end up with a chi square statistic. The idea is that the closer to zero the chi square statistic is, the more regional. The higher the chi square statistic, the more it’s deviating from the national distribution, thus being more local.
Doing the math, here’s what we get for US restaurants that have more than 100 locations (top and bottom 15):
|
NAME |
LOCATIONS |
CHI SQUARE |
|
Mcdonalds |
13811 |
0.070046944 |
|
Subway |
24105 |
0.103919262 |
|
Burger King |
7034 |
0.119288867 |
|
Godiva |
3679 |
0.150437442 |
|
KFC |
4655 |
0.152629049 |
|
Dominos |
4830 |
0.18811625 |
|
Applebees |
1867 |
0.203611562 |
|
Bolthouse Farms |
20408 |
0.210399793 |
|
Taco Bell |
6076 |
0.217482468 |
|
Wendy's |
5795 |
0.219231556 |
|
Olive Garden |
784 |
0.222174748 |
|
Pizza Hut |
6530 |
0.257761281 |
|
Chucke Cheese |
529 |
0.274454515 |
|
Papa Johns |
2835 |
0.291444446 |
|
Red Lobster |
679 |
0.293296582 |
|
… |
||
|
… |
||
|
Bob's Big Boy |
124 |
21.35187178 |
|
Taco Bueno |
177 |
21.49879157 |
|
Taco Time |
234 |
21.6098216 |
|
Vocelli |
101 |
22.02710021 |
|
ABC Wine and Spirits |
135 |
22.69824962 |
|
Taco Del Mar |
121 |
23.79662662 |
|
Sharis |
102 |
26.50148421 |
|
Braum's |
279 |
27.26602181 |
|
Mountain Mike's |
150 |
29.9897022 |
|
Tedeschi |
177 |
38.50929883 |
|
Cousin Subs |
140 |
40.21931153 |
|
Skyline Chili |
130 |
40.32505047 |
|
Mazzio's |
153 |
48.41473573 |
|
Honey Dew Donuts |
142 |
51.92285407 |
|
Dutch Brother's |
169 |
64.00169676 |
It’s no surprise here that the most national stores have the most locations and the most local stores have the least. Of course if a store has more locations, it’s more likely to be spread out. But it’s interesting to note the chains that are in the top 15 that have a lot fewer locations than the others, specifically Olive Garden, Chuckie Cheese, and Red Lobster.
Olive Garden has approximately 784 locations, with a chi square of .22. Whataburger has approximately 733 locations, which is fairly close to Olive Garden, but it has a chi square of 10.62. We can see the difference graphically:
Olive Garden:

Whataburger:
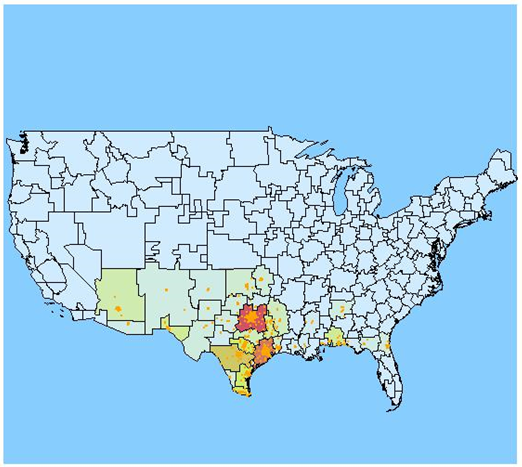
The map of Olive Garden shows more red in all of the major city centers of the US, while Whataburger is clearly marketing to Texas and the South. Now let’s take a look at the most local chain on the list, Dutch Brothers:

Dutch Brothers has a chi square of 64, even though it may appear to have a similar distribution as Whataburger, which had a chi square six times lower. The difference is first the fact that Dutch Brothers has a lot fewer locations. The second reason, and the primary reason, is that it is focused on parts of the US that are less populated than Whataburger. Texas has huge cities, so a Texas based chain will be closer to the distribution of the population than a chain in less populated areas. As you can see on the map, Dutch Brothers is focused on the west coast, but not the most populated parts of the west coast. They cover eastern Washington, Idaho, and Oregon, making the distribution lopsided. Thus, Dutch Brothers is a solidly local chain.